holisticai.explainability.plots.plot_surrogate#
- holisticai.explainability.plots.plot_surrogate(feature_importance: Importances, ax=None, **kargs)[source]#
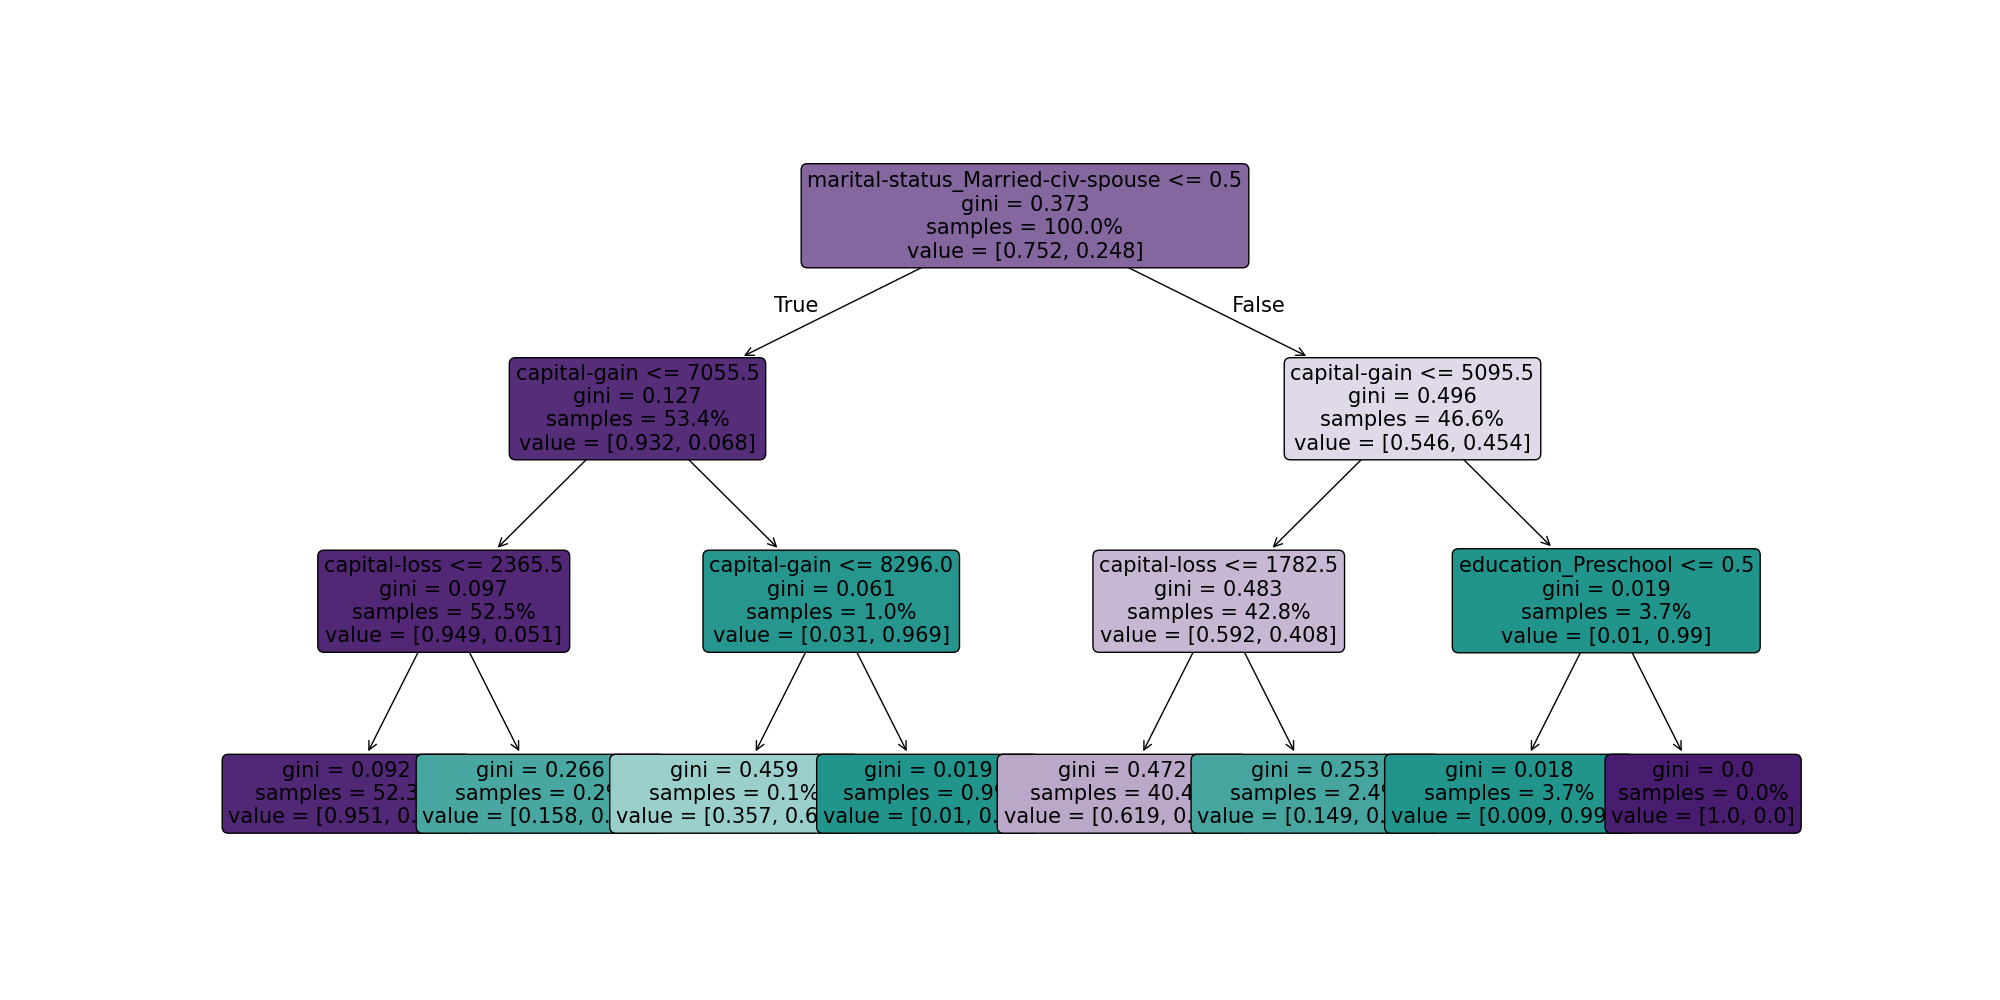
Plots the surrogate tree for feature importance.
Parameters
- feature_importance: Importances
The feature importance object.
- ax: (matplotlib.axes.Axes, optional)
The matplotlib axes to plot the tree on. If not provided, a new figure and axes will be created.
- kargs:
Additional keyword arguments to be passed to the plot_tree function.
Returns
ax: matplotlib.axes.Axes
Example
>>> plot_surrogate(feature_importance)
The plot should look like this: