holisticai.explainability.plots.plot_partial_dependence#
- holisticai.explainability.plots.plot_partial_dependence(partial_dependence: PartialDependence, ranked_feature_importance: Importances, subplots=(1, 1), figsize=None, class_idx=0)[source]#
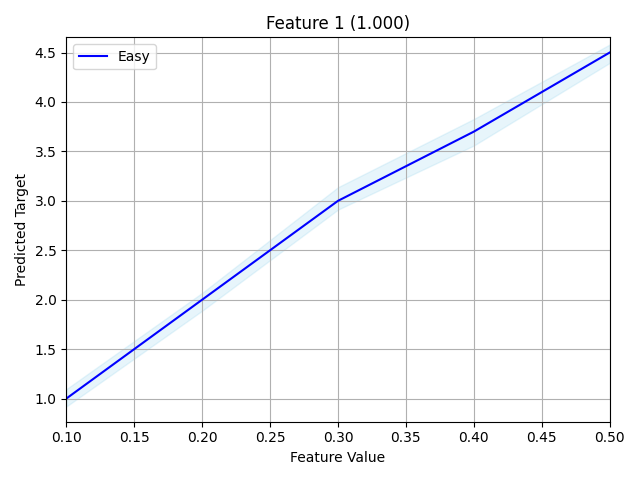
Plots the partial dependence of features on the predicted target.
Parameters
- partial_dependence: PartialDependence
The partial dependence object containing the computed partial dependence values.
- ranked_feature_importance: RankedFeatureImportance
The ranked feature importance object containing the feature names and their importance scores.
- subplots: (tuple, optional)
The shape of the subplots grid. Defaults to (1, 1).
- figsize: (tuple, optional)
The size of the figure. Defaults to None.
Returns
fig: The matplotlib figure object containing the plot.
Example
>>> partial_dependence = PartialDependence(values=[...])
>>> ranked_feature_importance = Importances(values=[...], feature_names=[...])
>>> plot_partial_dependence(partial_dependence, ranked_feature_importance)
The plot should look like this: