holisticai.explainability.plots.plot_feature_importance#
- holisticai.explainability.plots.plot_feature_importance(feature_importance: Importances, alpha=0.8, top_n=20, ax=None)[source]#
Bar plot of ranked feature importance.
Parameters
- feature_importance: Importances
The feature importance data.
- top_n: (int, optional)
The number of top features to display. Defaults to 20.
- alpha: (float, optional)
Percentage of importance to consider as top features. Defaults to 0.8.
- ax: (matplotlib.axes.Axes, optional)
The matplotlib axes to plot on. If not provided, a new figure and axes will be created.
Returns
matplotlib.axes.Axes: The matplotlib axes object containing the plot.
Example
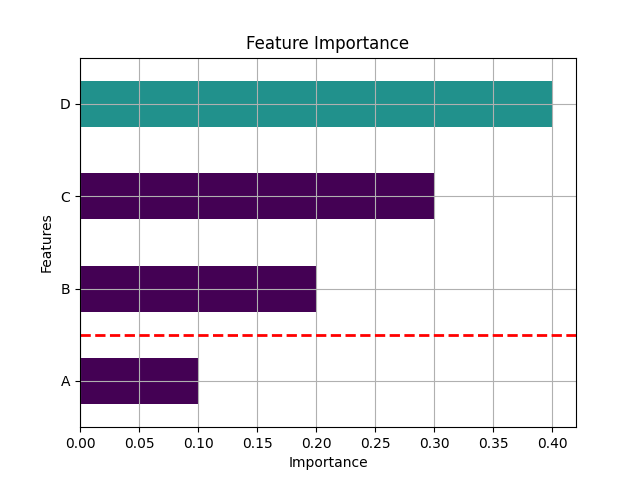
>>> feature_importance = Importances(
...     values=np.array([0.1, 0.2, 0.3, 0.4]), feature_names=["A", "B", "C", "D"]
... )
>>> plot_feature_importance(feature_importance)
The plot should look like this: